Roll test of DUALEM zero settings
DUALEM sensors have zero levels that are set prior to shipment, based on careful tests at our calibration site. You can check the zero-levels of your sensor by holding it overhead and rolling it about its long axis. The roll test is a convenient way to check the calibration of the DUALEM-1S and the DUALEM-1HS. The test is also robust for the perpendicular arrays of longer sensors and the horizontal coplanar arrays of those sensors that are 1-m-or-less in length.
Preparation for the test
1. This test requires that you roll the sensor through at least one full turn while holding it overhead, so place a mark (Mark) on the bottom of the sensor for visual reference.
2. Ideally, you should test outdoors, at least several metres away from any structure (e.g. fence, vehicle) that has substantial area bounded by metal, and farther from any equipment carrying electrical current. If the test produces unusual results, you should check again for any effect of metal. Structures that are grounded and/or carrying electrical current can affect measurements to a distance exceeding tens-of-metres.
3. If the sensor is close to ambient temperature, you should connect power and wait about 30 minutes before beginning the test. If the sensor is more than a few oC from ambient temperature, you should connect power and wait about 1 hour before beginning the test.
4. Your hands, arms and head should be free of metal, and you should remove any metal that you can from your body or clothing.
5. You might obtain less noise in your HCP measurements if the long axis of the sensor is oriented roughly east-west.
6. If you have no-one to trigger measurements while you hold the sensor, start automatic measurement when you are ready to raise the sensor overhead and stop measurement after you have returned the sensor to a secure location.
Running the test
1. Hold the sensor as high as you comfortably can. (The test is robust, regardless of electromagnetic irregularity in the earth, if the sensor is at least 2 array-lengths above the ground surface.)
2. Orient the Mark so that soon after the start of the test, the Mark will pass through the bottom position. Start the test, then roll the sensor slowly to move the Mark through the bottom position and continue slowly in the same direction until the Mark completes a roll and passes again through the bottom position. When the measurement interval is 1 s, a roll that takes about one minute is usually slow enough to acquire diagnostic data. In locations of high noise and/or low signal, you need to measure more slowly and carefully.
3. After the Mark has passed a second time through the bottom position, you can stop taking measurements. Completing several rolls during a test, however, and performing a second test with the sensor in a different alignment (e.g. north-south after east-west), can enable a fuller evaluation of the sensor and test conditions.
Evaluation
The following chart shows theoretical results of DUALEM-1HS at 2-m height over a 30 mS/m earth, where the Mark has passed twice through the bottom position.
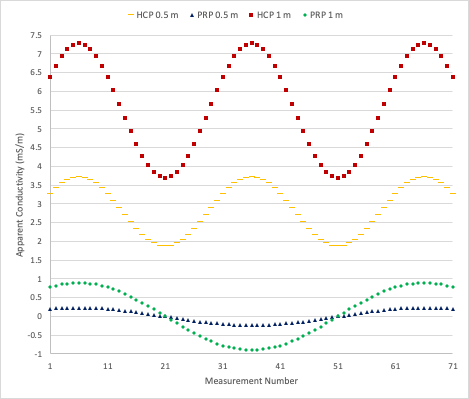
Through this test of slightly more than one roll, PRP values have two maxima and one minimum of opposite (+, -) polarity but equal amplitude. A test result is unusual if the difference in absolute amplitudes of the maxima and minimum is more than 1 mS/m.
Through the test, HCP values should be positive and show three maxima and two minima. The maxima occur as the Mark passes through the bottom and top positions, and the minima occur as the Mark passes through the two “sideways” positions. As shown in the chart, for each array the amplitude of the mimina should be about half the amplitude of the maxima. A result is unusual if it indicates all values should be adjusted by more than about 3 mS/m for a 1-m HCP array, and about 5 mS/m for a ½-m HCP array, as discussed in the following examples.
If the minima are negative or less than half of the maxima for a given HCP array, then all the values of the array are lower than they should be. For example, if the minima are around -1 mS/m and the maxima are around 1 mS/m, all the values are too low by about 3 mS/m; if they were raised by this amount, the minima would be 2 mS/m and the maxima would be 4 mS/m (i.e. the minima would positive and half the maxima). Such a result would be on the threshold of unusual for a 1-m HCP array, as typical survey-day drift is about 3 mS/m. Such a result would not be unusual for a ½-m HCP array, which typically has higher drift.
If the minima are more than half the maxima for a given HCP array, then all the values are higher than they should be. For example, if the minima are around 6 mS/m and the maxima are around 9 mS/m, all the values are too high by about 3 mS/m; if they were lowered by this amount, the minima would be 3 mS/m and the maxima would be 6 mS/m.
Corrective action
The zero-levels of DUALEM sensors are set with system software. Users of sensors with serial number 133 and higher should be able to adjust the settings through the Hidden Menu, as documented in their user manual. If the Hidden Menu is not accessible, the user might adjust measurements post-acquisition by test-indicated amounts.
Dualem welcomes the opportunity to review tests, especially any test with unusual results. Please send any results with all measured parameters, including roll angle.
Examples of the DUALEM roll test
Examples of the test follow, courtesy of Precision Agronomics Australia (PAA) of Esperance, WA. PAA ran the roll test with two DUALEM-1Ss, one from 2006 and another from 2008. The sensors were set to output measurements twice per second.
Figure 2 shows the apparent conductivities from the 2006 sensor. The rotation of the sensor took just over 1 minute, as there are 122 measurements of the dual conductivities. HCP values range between 11 and 17; since the minima are more than half the maxima, all values are higher than they should be. The test indicates that the values should be decreased by about 5 mS/m, which would make the values range from 6 to 12.
The PRP values range from -2 to 3, indicating that the PRP zero level is accurate to within 1 mS/m.
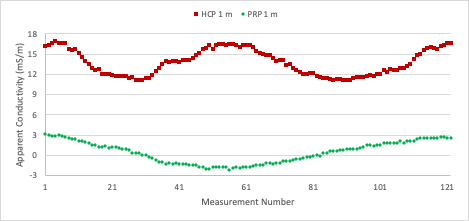
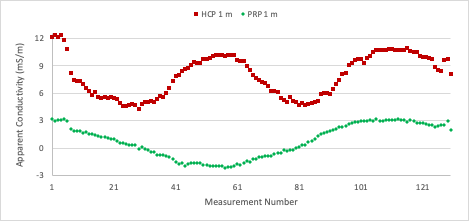
Figure 3 shows apparent conductivities from the roll test of the 2008 sensor, which indicate zero levels for this sensor are accurate to within 1 mS/m, and that the test-indicated adjustment of the 2006 sensor is appropriate.
Theoretical basis
The theoretical basis of the roll test is A Note on the Electromagnetic Response of a Stratified Earth: Geophysics, 27 (1962), 382-85 by James R. Wait. Wait noted that at sufficiently low frequency, the depth sensitivity of an array (e.g. HCP, PRP and vertical coplanar or VCP) is a function of (only) the length of the array. He observed that the response measured by an array over layered conductivity is the sum of the conductivity of each layer times the sensitivity the array accumulates through the depth range occupied by each respective layer.
Following Wait, if zero is the conductivity of air, z is depth below an array to the ground surface, C(z) is the function of cumulative sensitivity with depth, D is the conductivity of the ground, and A is the apparent conductivity measured by the array,
A = 0·C(z) + D(1-C(z))
Following subsequent work by Wait and others, the cumulative sensitivity function of the HCP array is
CH(z) = 1 – 1/(4z2 + 1)1/2
When the HCP array is rotated 90o about its long axis relative to the earth, it becomes the VCP array with cumulative sensitivity function
CV(z)= 1 + 2z – (4z2 + 1)1/2
At a height of 2 array-lengths, the coplanar apparent conductivities measured in the roll test are
AH = D(1-CH(2))
when the coplanar array is in its normal HCP orientation, and
AV = D(1-CV(2))
when the coplanar array is rotated 90o to its VCP orientation.
The ratio of AV/AH is
(1-CV(2))/(1-CH(2)) = ((4(2)2 + 1)1/2 – 2(2))/(1/(4(2)2 + 1)1/2) ≈ 1/2
For arrays at zero height, the AV/AH ratio is 1:1. At height many times the array length, the asymptote of the AV/AH ratio is 1:2.
Conductive layering in the earth affects the AV/AH ratio. Surficial conductivity that is lower than underlying conductivity decreases the ratio towards its asymptote. Surficial conductivity that is higher than underlying conductivity increases AV relative to AH, but not significantly at a height of twice the array length; for example, a surficial layer that is 100-times as conductive as the underlying earth can raise the ratio to 104:200 from a ratio of 102:200 where there is no layer.
To describe the responses of a PRP array in a roll test, let a vertical Z axis intersect the transmitter, an X axis intersect the transmitter and receiver, and note that the dimensions of a DUALEM allow the transmitter to treated as a dipole.
In normal orientation, the transmitter dipole lies along the Z axis; let us designate the pole nearest the earth as positive and the pole furthest from the earth as negative. The axis of the PRP receiver lies along the X axis, so its orientation is constant throughout the roll test. As roll begins, the earth becomes less exposed to the positive pole and more exposed to the negative pole until, at roll of 90o, exposure is equal and the opposite poles induce equal and opposite response in the earth relative to the receiver. The change in exposure continues with roll until, at roll of 180o, full exposure of the negative pole induces response that is equal in amplitude but opposite in polarity to the response in normal orientation. Through the remainder of the roll, the changes in exposure are undone until, at roll of 360o, full positive exposure and response are restored in normal orientation.
Inphase check
The roll test is a convenient way as well to check inphase zero-levels; HCP inphase varies with the same ratio and PRP inphase varies with the same polarity as the apparent conductivity of these arrays.
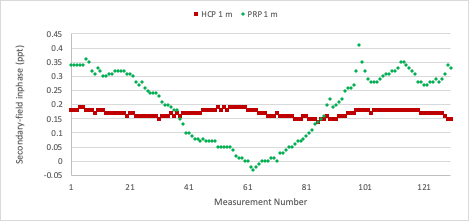
Figure 4 shows roll-test inphase measurements for the 2008 DUALEM-1S of PAA. All HCP values appear to be about 0.1 ppt too high, and all PRP values appear to be about 0.15 ppt too high.
Dualem Products
DUALEM products are used by companies and universities on every continent. Our products fulfill a variety of use-cases in industry and academia.